
Investment Intelligence: Q1’26 Active Deal Pipeline Insights
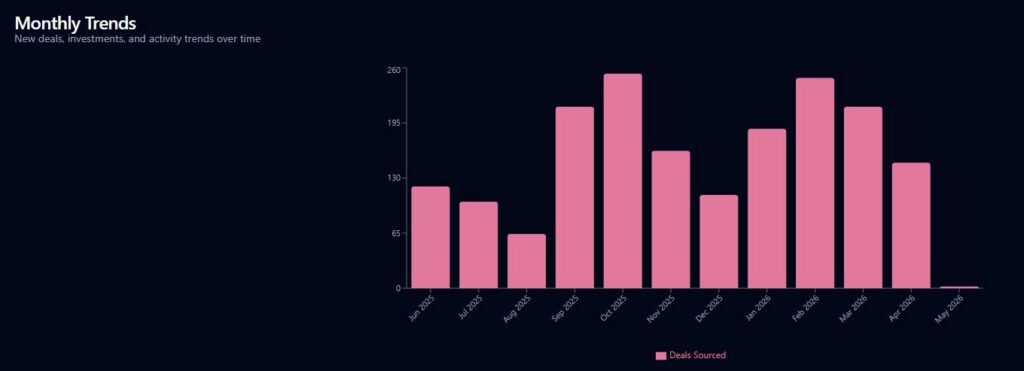
DCA uses its data-driven strategy to inform investment decisions and identify potential opportunities for its clients. The following stats are based on 650+ deals sourced during Q1.
Active Deal Pipeline
Q1’26 Deal Spotlight
DCA sourced over 650 deals in Q1’26, a 128-deal increase (24.5% QoQ) over deals sourced in Q1’25. Of those, 100+ met the firm’s initial investment benchmarks and were screened for further review. All of this reflects the firm’s revamped, accelerated scouting and deal-sourcing processes.
Investment Vehicles: SAFEs Continue to Dominate
Over 67% of Q1’26 deals were raised on SAFE notes, reflecting the prevalence of SAFEs in the early-stage VC market. The standard VC SAFE is cheaper and more accessible for founders raising smaller rounds. Investors are also becoming more comfortable with larger SAFE raises, thanks to the introduction of side letters with special provisions such as MFN and pro rata clauses.
That said, early-stage investors and founders should understand the inherent risks of SAFEs, including the lack of investor rights protection in future priced rounds, the absence of formal governance structures, and cap table complexity when raising future SAFE rounds at different valuations.
It’s worth noting that SAFE usage dipped to 58% in Q2’25 as Convertible Notes gained traction, but Q1’26 data suggests SAFEs have regained their footing as the preferred early-stage vehicle.
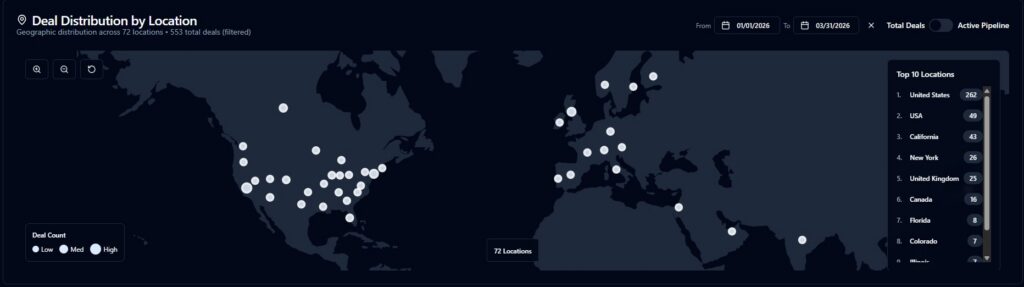
Geography: Coast-Heavy, Globally Diverse
California (31%) and New York (15%) accounted for almost half of Q1’26 deal flow, followed by Texas (6%), Massachusetts (5%), and Colorado (4%). In total, DCA screened deals from 35 different states and 27 countries in Q1’26 alone, reflecting the firm’s strong national and global investor network and its geography-agnostic investment strategy.
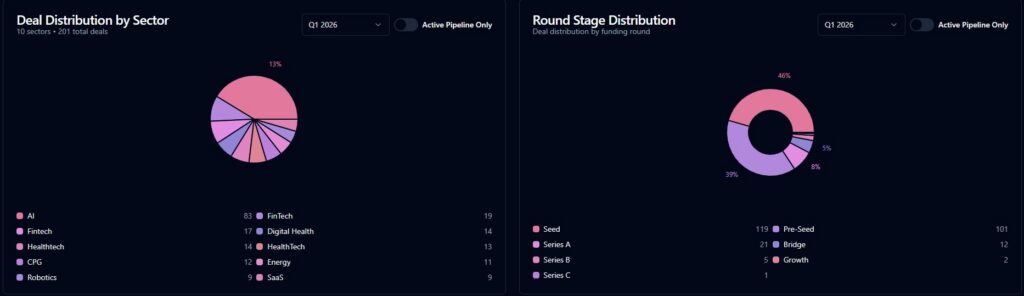
Funding Stages: Seed Remains the Sweet Spot
Roughly half of the deals screened in Q1’26 (51%) were in the Seed and Seed Extension rounds, with 40% in the Pre-Seed stage and 9% in Series A+. The firm continues to actively source early-stage VC deals with a preference toward Seed, but remains opportunistic across the entire early-stage investment curve.
Verticals: AI Holds Its Lead
AI (38%) and Digital Health (13%) were the two largest vertical segments screened in Q1’26, followed by FinTech (12%) and SaaS (11%). In total, DCA screened deals across over 40 verticals, with a core focus on its target verticals: AI, Vertical SaaS, Digital Health, Fintech, and Space & Defense.
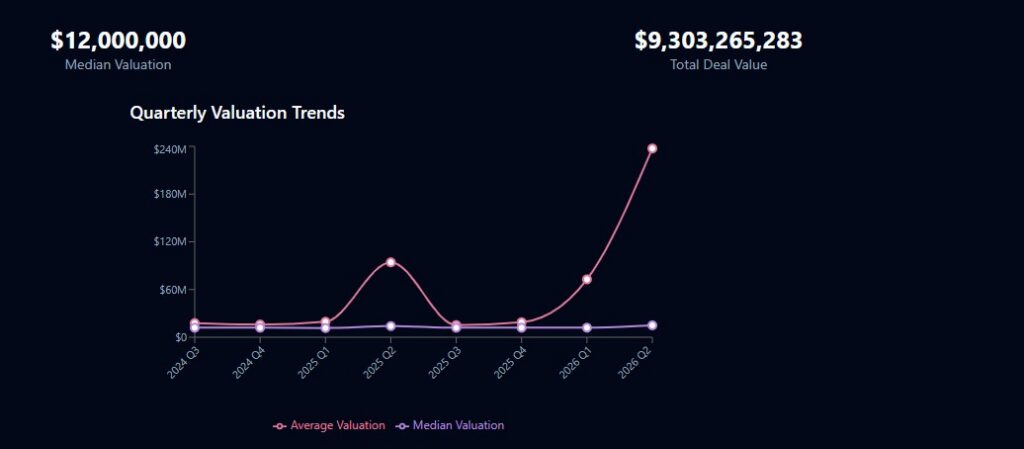
Valuation: Steady Median, Slight Multiple Uptick
The median valuation across all Q1’26 sourced deals was $12M (flat QoQ), with a median 28x EV/Rev multiple (+14% QoQ). The slight increase in multiple metrics QoQ was driven by an increased number of higher-valuation AI deals.
Data-Driven Deal Analysis
DCA Asset Management remains committed to using data-driven strategies to inform its investment decisions. These Q1’26 pipeline insights offer a look into the firm’s investment philosophy and approach as it continues to identify high-growth-potential startups across the early-stage landscape.
—
This content, which contains security-related opinions and/or information, is provided for informational purposes only and should not be relied upon in any manner as professional advice, or an endorsement of any practices, products or services. There can be no guarantees or assurances that the views expressed here will be applicable for any particular facts or circumstances, and should not be relied upon in any manner. You should consult your own advisers as to legal, business, tax, and other related matters concerning any investment.
The commentary in this post reflects the personal opinions, viewpoints, and analyses of the DCA employees providing such comments, and should not be regarded as the views of DCA Asset Management or its respective affiliates or as a description of advisory services provided by DCA or performance returns of any DCA clients.
References to any securities or digital assets, or performance data, are for illustrative purposes only and do not constitute an investment recommendation or offer to provide investment advisory services. Charts and graphs provided within are for informational purposes solely and should not be relied upon when making any investment decision. Past performance is not indicative of future results. The content speaks only as of the date indicated. Any projections, estimates, forecasts, targets, prospects, and/or opinions expressed in these materials are subject to change without notice and may differ or be contrary to opinions expressed by others.